Foot traffic data for your downtown
See who visits your district and where they come from, how weekdays compare with weekends, and what your events, promotions and projects changed. Built from privacy-compliant mobile data, with no sensors or counters to install.
Your members, your board and council all ask the same question
Is the street getting busier, and did the things we spent money on make a difference? Most BIAs answer with member anecdotes, a few pedestrian counts and the odd survey.
Counters show volume at one spot, not who the visitors are or where they came from. And when a streetscape or construction project starts, there is often no baseline to compare against later.
What the report shows
Every figure is a share or an index, measured the same way each time, so you can track your district against itself.
Who visits and from where
The share of visitors who are local, regional or from further away, and the home areas they come from.
Weekdays vs weekends
How traffic splits across days and hours, so you can see when the street is busy and when it is not.
Event and promotion impact
Traffic during an event or promotion against ordinary periods, for the event site and the wider district.
Reach across the district
How far visitors move through the district, beyond the block where the event or anchor sits.
Your district over time
The same measures month over month and year over year, so you can show the trend, not a snapshot.
Before and after a project
A baseline before a streetscape or construction project starts, then the same measures during and after.
How it works
A first report usually takes 2 to 3 weeks.
Draw the district
Your BIA boundary, a main street, or the blocks you care about, plus the dates or projects to measure.
We measure
We compare the periods you choose using privacy-compliant mobile data, with the method stated.
You get the report
Indexed findings and charts, written for your board, your members or council.
Repeat it
Run the same measures next season or after the project, so the comparison holds.
A community event shows the whole town benefited
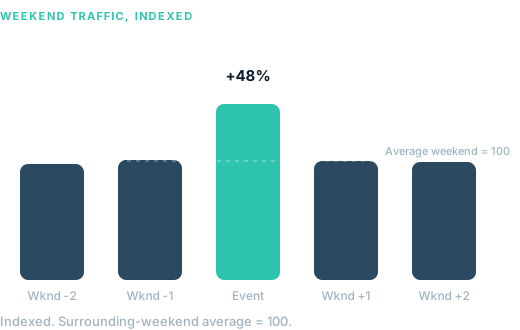
A recurring downtown event in the Niagara region needed evidence for its municipal and funding partners. We measured the event weekend against ordinary weekends across two years, for the venue and the surrounding town.
Read the case study →Who it's for
- BIAsEvidence for your members and your board
- Downtown associationsTrack the core and show what changed
- Municipal economic developmentCompare districts and plan where to invest
- Main street and revitalization programsSet a baseline before work starts
Measuring a single festival or event? See our event impact reports.
Questions
Do we need to install counters or sensors?
No. The report uses privacy-compliant mobile data, so there is no hardware to buy, install or maintain. If you already have pedestrian counters, the two work well together.
Can you tell us how many people visited the district?
No. We measure a large sample of devices, never everyone, so we report indexed change and shares rather than headcounts. Pair our shares with your own counts if you have them.
Construction has already started. Is it too late for a baseline?
It depends on when work began. We can look back up to 24 months, so if work started within that window we can often build a baseline from the period before.
Can you measure a past event or promotion?
Yes, if it took place within the last 24 months.
How do you handle privacy?
Every insight is aggregated and anonymized. We collect no personal information, and our data and methods are built to meet PIPEDA and the provincial privacy rules that apply where we work.
How long does it take?
A first report usually takes 2 to 3 weeks from when we agree the boundary and dates.
See what is really happening on your street
Tell us your district. We'll start with a complimentary sample insight.