Event impact reports funders can trust
Show what your event actually did: how much traffic rose, where visitors came from, and how far the benefit spread across town. Built from privacy-compliant mobile data, with no survey needed.
Anecdotes don't win funding
Funders, councils and sponsors want evidence that an event brought people in. Most events still rely on attendance estimates and visitor surveys.
Surveys reach a small group, and they often miss the out-of-town visitors who matter most to a funding case. Ticket counts can't show where people came from, or whether the rest of the town benefited.
What the report shows
Every figure is a share or an index, with the method stated, so it holds up in a funding review.
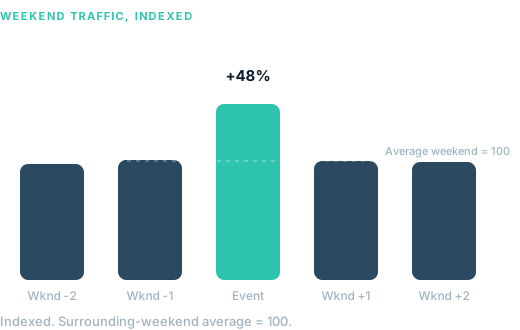
Event lift
Traffic during the event against ordinary weekends, for the venue and the surrounding area.
Visitor origin
The share of visitors who were local, regional or from further away, by distance band.
Day and time patterns
Which days and hours grew, so you can see what the programming changed.
Spread across town
How much of the surrounding area visitors reached, beyond the event site itself.
Year-over-year change
The same measures against last year's event, when you want to show growth.
Ready for your application
A clear write-up with the method stated, for funders, council reports or sponsors.
How it works
A first report usually takes 2 to 3 weeks.
Tell us the event
Dates, location and the area you want measured: the venue, a downtown, or a whole town.
We measure
We compare the event period with ordinary weekends using privacy-compliant mobile data.
You get the report
Indexed findings, charts and the method, written for your funders or council.
Track it over time
Repeat it next year to show change, with the same method.
A community event proves it deserves its funding
A recurring downtown event in the Niagara region needed evidence for its municipal and funding partners. We measured the event weekend against ordinary weekends across two years.
Read the full case study →Who it's for
- Festivals and eventsEvidence for funders, sponsors and your board
- BIAs and downtown associationsShow the street benefited, not just the venue
- Municipalities and economic developmentCompare events and plan where to invest
- Tourism organizationsVisitor origin for destination planning
Visitor origin shares help you split your own attendance figures into local and out-of-town visitors, the split that spending-based impact models such as Ontario's TREIM rely on.
Questions
Do we need to run a survey?
No. The report uses privacy-compliant mobile data, so it covers visitors who never fill in a survey. If you already run a survey, the two work well together.
Can you tell us how many people attended?
No. We measure a large sample of devices, never everyone, so we report indexed change and shares rather than headcounts. Pair our shares with your own ticket or gate counts.
Can you measure an event that has already happened?
Yes, if it took place within the last 24 months.
Is it privacy compliant?
Yes. Every insight is aggregated and anonymized. We collect no personal information, and the method follows PIPEDA and provincial privacy rules.
How long does it take?
A first report usually takes 2 to 3 weeks from when we agree the area and dates.
What do you need from us?
The event dates, the location, and the area you want measured. Nothing else is required.
See what your last event did
Tell us the event. We'll start with a complimentary sample insight.