Trade area analysis built from real visits
See where your customers actually live, by six-digit postal code, which competitors they also visit, and how each location's catchment differs. Built from privacy-compliant mobile data, for retail, restaurant and franchise brands across Canada.
A radius on a map is not a trade area
Most trade areas are drawn as a circle around the store, or built from loyalty data that only covers the customers who signed up. Neither shows where visitors really come from.
Real catchments follow highways, commutes and competitors. Two stores a few kilometres apart can draw from very different places, and share more customers with a rival than with each other.
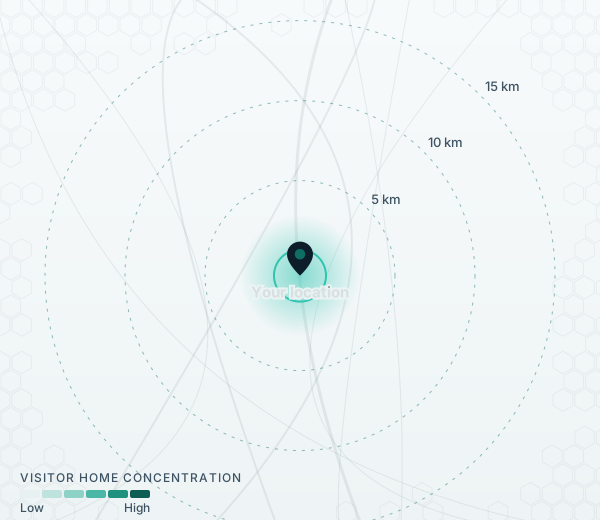
What you get
Built for site, media and local marketing decisions. Every figure is a share or an index, with the method stated.
Your true catchment
Where each location's visitors live, at the six-digit postal code level, ranked by concentration.
Distance bands
The share of visitors from near, mid and far, so you can see how far each store really reaches.
Overlap with competitors
Where your trade area meets a competitor's, and how much traffic you share.
Cross-shopping
Which competitors and categories your visitors also choose, shown as indexes.
Day and daypart patterns
When each location's audience shows up, by day of week and time of day.
Reach the trade area
Postal codes for direct mail and out-of-home, and audiences for programmatic, connected TV and social, including competitor visitors.
How it works
A first analysis usually takes 2 to 3 weeks.
List the locations
Your stores or restaurants, the competitors you care about, and the period to measure.
We map the visits
Visitor home areas and cross-shopping, from privacy-compliant mobile data.
You get the analysis
Maps, indexes and a short write-up for each location or region.
Put it to work
Use it for media plans, local marketing, site decisions, or to reach competitor visitors.
The same method, applied to venues
We don't have a published retail case study yet, so here is the closest example. A digital screen network in community sports venues used the same visitation indexing to compare its venues with competing venues. This was a venue client, not a retailer.
Read the case study →Who it's for
- Retail brandsTrade areas, cross-shop and network decisions
- Restaurants and QSRCatchments and competitor overlap by location
- Franchise systemsCompare locations and support franchisee marketing
- Agencies with retail clientsReal-world trade areas ready for the media plan
See how trade area maps fit with audiences, activation and measurement on our capabilities page.
Questions
How is this different from a radius or drive-time map?
A radius assumes everyone nearby is a customer. We map where real visitors to your location live, by six-digit postal code, so the trade area follows actual behaviour.
Can you include our competitors' locations?
Yes. We can measure visits to competing locations the same way, and show where trade areas overlap and how much traffic you share.
Can you tell us sales or how many customers we have?
No. We measure visits, not purchases, and we measure a large sample of devices, never everyone. We report shares and indexes. Pair them with your own sales data.
Can we reach the people in our trade area?
Yes. We deliver postal codes for direct mail, out-of-home and geo-targeting, and audiences for programmatic, connected TV and social platforms. Your audience data is never sold, and we reach patterns at scale, never individuals.
How long does it take, and how far back can you look?
A first analysis usually takes 2 to 3 weeks. We can look back up to 24 months.
How do you handle privacy?
Every insight is aggregated and anonymized. We collect no personal information, and our data and methods are built to meet PIPEDA and the provincial privacy rules that apply where we work.
See where your customers really come from
Start with a complimentary sample insight on one of your locations.